The Centers for Disease Control and Prevention has not yet publicly provided comprehensive state testing counts. The
COVID Tracking Project is doing so here, however results vary based on how state health departments report tests and infections.
No plan in sight: Test troubles cloud Trump recovery effort
Farzad Mostashari, previously CDC EIS Officer interprets the data this way:
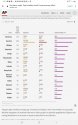
Here's the map of positive rates by state
NY, NJ > 40% (my gosh)
MI, CT > 30%
GA, MA, IL, CO > 20%
PA, DC, MD, IN, LA, DE, VA > 15%
RI, SD, AL, NV, SC, IA, CA, PR, TX, MO, FL, KA > 10%
None of these states should be reopening til + rate is 5% or less
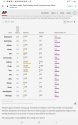
You can also look at the change in positivity week by week in different states
Sharpest increases in + rate:
SD went from 10% -> 24% + samples
KY 5%-> 14%
DE 16% -> 25%
MD 19%->26%
SC 6%->13%
VA 15% -> 22%
@GovernorVA doesn't need protestors telling him to open up right now
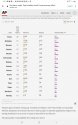
Fortunately, there are also some states that have a declining positivity rate, giving promise to some hard-hit states that the outbreak may have crested (clinical correlation required!)
LA down 25% -> 11%
WA 16%->4% (great job WA State)
CT 39%->32%
GA 29%->22%
MI 33%->27%
So when we see these national trends, it's reflecting some areas where the outbreak seems to be coming off sky-high positivity levels, and others where it appears to be going up, in many smaller markets like South Dakota
But overall, positive rates are HIGH and trends are up
Farzad Mostashari on Twitter
But we have to look at all the data together to see what's going on, not just positivity rate - Trends in Cases, Hospitalizations, Deaths (remembering that there is a time lag between each stage)
COVID-19: Data - NYC Health