Hi all. This is my first WS post. It’s an exceptionally long one, but I wanted to be thorough about the…
FIVE ATTACHED ANIMATED WEATHER SATELLITE GIF’s… and what they reveal.
I’ve been closely monitoring and researching the details of this case, and though I’ve only had time to scan a few pages of thread #1, I’ve carefully read ALL the posts from threads #2 thru until now, considering all the theories, opinions, and enigmas that revolve around this tragic story.
My main purpose here is to provide the attached weather GIFs to WS users, so the details they reveal can be assessed, and lastly to share a few observations I have about them.
The GIFs provide a deeper dive into the weather on the day of Jonathan & Ellen’s hike which - as can be seen - indicate that conditions for possible electrical and/or lightning events became VERY LIKELY later in the afternoon to evening. This raises some interesting considerations, as will be addressed later in this post.
None of the GIFs provide AIR TEMPERATURE at ground level unfortunately as they’re satellite based instruments primarily focused on cloud density, height, movement, temperatures aloft. These however provide vital clues by which other conditions on the ground may be extrapolated.
Like many on this forum, my first impressions of the case - given the heat index for that day and the excruciating nature of the switchbacks on the Savage-Lundy climb, was that death by heatstroke was a distinct, and seemingly likely, cause.
Like many too, I’ve scratched my head as to WHY J & E would have “sensibly” attempted that brutal switchback climb in the heat of that particular day. Every available piece of background on Jonathan and Ellen indicates they were savvy, resourceful, and INTELLEGENT people.
If an urgent need to climb the switchbacks to reach their truck – in spite of the heat – was brought on by a life-or-death need to get the baby (or the dog) to help, then it’s at least understandable, if lamentable, why they might have pushed themselves to the brink of death. But barring a life-threatening issue, I feel that given the heat of the day (MOO) they were – MOST LIKELY – smarter than that.
And it should be considered that when preparing for the hike, had they used a weather app with their home area (i.e. zip code 95338) as the forecast location, the highs that day would have been predicted to only be in the upper 90’s. The recorded high at the Jerseydale weather station (ID: JSD Elev. 3,900), closest to their home, was 97 degrees at 2pm. Leaving at 8AM on a 7.1 mile hike which they may have estimated would take about 4 hours would have put them back at their truck by noon. The weather station at JSD recorded the noon temperature at 94 degrees. (See:
JERSEYDALE (JSD) )
It should also be considered that the often touted “109 degree heat” was the recorded high at the El Portal Station ONLY (ID: EPW at 2,070 feet in elevation), whose station sits on a south facing slope in the Merced River Canyon. No other weather stations within dozens of miles around the area reported a high anywhere near that extreme that day. Even the station at the El Portal water Treatment Plant (ID: X04) only reported a high of 105, and that station is only 2 miles downriver from EPW.
I checked over a dozen other weather reporting stations in the area for the day, but only the two at El Portal, some six miles north of the family’s hiking location reported anything much above 100 that day. Whether the El Portal stations registered abnormally high due the microclimate in the canyon where they are located is not certain. But I feel we cannot be entirely be sure what the EXACT temperatures were like for J & E during any part of their hike. It was HOT throughout the region that day for sure, but categorically assuming it was as hot as 109 (as opposed to say 101) for them at a given hike juncture simply cannot be backed up by any direct evidence.
(For historic temperature recordings for a given area in California (used above), see the CDEC Station Locator map at
Web Map Viewer and use the “Query Tools” menu link and station ID/date to find historic data).
The point here is that J & E, with their extensive history of hiking, frequently honed experience, seemingly good physiques, and plenty of youthful enthusiasm, undoubtedly felt they would be fine. It’d be a work-out yes. But that was likely the point. And according to statements attributed LE they appeared to have been “well prepared”.
So something has always nagged at me: If heatstroke were indeed the primary cause, the close proximity of their bodies (including baby & dog) feels problematic. Though certain “heat-based” scenarios can be imagined that resulted in how the bodies were found, in terms of “only heatstroke as a cause”, something (MOO) has always felt a little “off” about it.
Nonetheless, from an Occam’s Razor POV, heatstroke “seems” to be the most likely explanation.
That said… this is a very unusual case with a rarely seen outcome. So it follows that a “rarely seen” explanation could very possibly be afoot.
So… that brings up the satellite data. Lightning? Was it possible? Were conditions ripe for it?
I wanted to find out.
The idea of some sort of “mass electrocution” event – albeit a MUCH, MUCH rarer event than heatstroke, is not unheard of. UNLESS of course, conditions were not favorable to such an event.
In Norway in 2016 some 323 reindeer were killed in one fell swoop by lightning. Strange yes, but it happens:
How exactly did lightning kill 323 reindeer in Norway?
As it turns out, based on the evidence in the attached GIF’s, conditions were VERY CONSISTENT - and arguably, VERY LIKELY - that lightning was not only present in the area but very possibly immediately overhead and surrounding their location in the LATTER part of the day.
As will be seen in the GIF’s below, two large storm cells did indeed roll directly over the switchbacks, the first one very late in the afternoon around 5PM-ish, and second just before sunset at around 7:30PM. Each of these two cells were initially generated over Yosemite’s central valley, and then each moved swiftly toward the WSW and DIRECTLY OVER the Savage-Lundy trail area.
The attached GIF’s were generated at
www.weather.us , whose easily searchable database for various types of satellite data is extensive. (Be advised, it requires a paid monthly subscription to view animations or generate GIFs, but for anyone researching past weather events, the fee is nominal).
Here’s some brief technical info on the animations in general, then a quick rundown of each file in terms of what type of data they contain and what to watch for…
----------------------------------
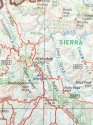
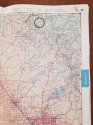
~ Each GIF has the Gerrish-Chung location (the SL switchbacks) MARKED WITH A DOT IN THE CENTER. I carefully marked this location by overlaying a semi-transparent GIF frame onto a Google Earth screenshot in Photoshop, carefully aligning the Mariposa County border, roads, and rivers, and then marking the spot. I am confident (given the large geographic extent of each GIF) this is very close their discovered location.
~ Sunset on August 15, 2021 at the Savage-Lundy trail was at 7:54 PM.
~ GIF’s #01 thru #04 (visible clouds, water vapor, cloud tops, infrared respectively) begin at 1pm and cover the next 8 hours, ending after dark at 9pm. There are 4 frames per second, with a 5-minute real-time interval between frames.
~ GIF #05 (doppler radar) begins at 12pm (when the first precipitation appears in the area) and extends for 9 hours, ending at 9pm. There are two frames per second, with a 10-minute real-time interval between frames.
~ Each frame has the California local time – i.e. Pacific Daylight Time or “PDT” at the lower right corner of the screen for reference.
~ All files are below 6.5MB, but it may take a few seconds to load each...
(Gerrish-Chung location is THE DOT at the center...)
--------------------
01-Satellite-Visible-Clouds-Color.gif
WHAT IT IS: This is the visible cloud movement as seen by a color satellite camera at 1k per pixel resolution. It’s how the clouds would generally appear to the naked eye from orbit. Cloud formations can be seen to develop and evolve. You can see each individual cloud grow, develop, and die off.
WHAT TO WATCH FOR: At 4:20PM a large and distinctly dark shadow begins to rise out of Yosemite Valley and develop quickly into a storm cell that moves swiftly to the WSW and over the family’s location. At 5:50PM another large cell evolves above the Yosemite Valley and moves in the same direction. I will henceforth refer to these as “CELL 1” and “CELL 2” respectively.
01-Satellite-Visible-Clouds-Color.gif

--------------------
02-Satellite-Water-Vapor.gif
WHAT IT IS: This view shows the moisture in the upper atmosphere right around 30,000 feet. This enables us to see a variety of weather features in the UPPER atmosphere including disturbances that can spark big thunderstorms. Because it doesn’t use the sun’s radiation to produce its images, you can see it both day and night.
WHAT TO WATCH FOR: Notice how Cell 1 and Cell 2 move directly toward - and are soon centered over - the Gerrish-Chung location at 5:25PM and 7:50PM respectively.
02-Satellite-Water-Vapor.gif

--------------------
03-Satellite-Cloud-Tops-Alert.gif
WHAT IT IS: This view shows the temperature of whatever the satellite is looking at including clouds, land, or water. The temperature is displayed on a color scale indicating increasingly colder cloud tops and thus very strong storms that can reach all the way up to the stratosphere. Greys and whites indicate warmer clouds as well as clear weather with no clouds at all. Because this view utilizes infrared radiation to produce its images as opposed to radiation from the sun, you can see it both day and night.
WHAT TO WATCH FOR: Like the water vapor images, Cell 1 and Cell 2 move quickly toward the WSW and are soon directly centered over the Gerrish-Chung location at around 5:25PM and 7:55PM respectively.
03-Satellite-Cloud-Tops-Alert.gif

--------------------
04-Satellite-Infrared.gif
WHAT IT IS: Similar to the vapor and cloud top data, this view shows the temperature of whatever the satellite is looking at including clouds, land, or water. The temperature is displayed on a gray scale with bright whites indicating very cold cloud tops and thus very strong storms that reach all the way up to the stratosphere. Darker grays indicate warmer clouds as well as clear weather with no clouds at all. Because this view utilizes infrared radiation to produce its images as opposed to radiation from the sun, you can see it both day and night.
WHAT TO WATCH FOR: Like the water vapor and cloud top images, Cell 1 and Cell 2 move quickly toward the WSW and are soon directly centered over the Gerrish-Chung location at around 5:25PM and 7:55PM respectively.
04-Satellite-Infrared.gif

--------------------
05-Doppler-Radar.gif
WHAT IT IS: This is your standard radar reflectivity data that shows precipitation or other solid/liquid particles in the atmosphere.
WHAT TO WATCH FOR: Though a small cell of precipitation passes to the SE of the Gerrish-Chung location around 3pm, the much larger precipitation from Cell 1 is closest at around 7PM, some 90 minutes after the center of the cell producing the rain was centered over their location. This indicates the precipitation from this cell was concentrated primarily on the trailing east-to-southeasterly edge of the cell. The precipitation from cell 2 appears to diminish altogether before reaching their vicinity. This may be due to the sun having set by then. Both however appear to grow and then loiter slightly in an area to the SE of the Gerrish-Chung location. This corresponds to approximately where 6,989 foot high Devils Peak is. This makes sense as the peak would naturally have deflected moisture laden air upward, resulting in rainfall. Though the rain came very close to them at times, in the entire 9-hour sequence, no appreciable amount of rain appears to have reached the Gerrish-Chung location, at least any that was recorded by the radar returns. Nonetheless, it’s clear from the other satellite data that the active cells that generated this “trailing edge” rainfall (and their potential for dry lightning events) passed squarely over the family that day.
05-Doppler-Radar.gif

--------------------
Some Final Thoughts and Observations:
1. Based on the satellite evidence conditions consistent for lightning events to have occurred were present above and around the family. The satellite data indicates beyond any shadow of doubt, two active and highly convective storm cells passed over the Savage-Lundy trail and were generally centered over it at 5:25pm and 7:55PM.
2. That if a lightning event indeed befell the family, it is most likely to have occurred from Cell 1 (5:25PM-ish) at the earliest, as the minor cell that passed by their location around 3PM did not register any appreciable upper atmospheric activity on the satellite vapor, cloud top, or infrared images. Whether the 3PM cell WAS a strong enough cell to generate lightning is perhaps unknowable. But based on the lack of upper atmospheric activity like the latter two cells clearly display, the 3PM cell seems much less likely to have been as electrically supercharged as the latter two.
3. Getting into MOO territory here…
Assuming for conjecture that the family (at least the adults anyway) were indeed felled in a freak lightning event caused by Cell 1 around 5 to 6PM when they were halfway up the Savage-Lundy trail, it stands to reason they hadn’t started up the switchbacks until an hour or so before, or around 4PM or thereabouts. This brings up an interesting point...
Had they not tarried to often on the first 2/3 of loop during the morning and had made good time (‘twas mostly downhill, then generally level along the river) they’d have arrived at the base of the Savage-Lundy switchbacks by noon or perhaps even a bit earlier. Surely by 1PM or so. This then leaves a several hour gap during the hottest part of the afternoon before they headed up the Savage-Lundy switchbacks.
One could speculate that having arrived at the base of the switchbacks around mid-day and having then realized it had become too hot for such an exposed and treacherous climb - they elected to WAIT OUT THE DAY’S HEAT. Most likely in some shade. Perhaps near the river.
To me, (again MOO), this seems consistent with what I have always felt about them. That they were two very intelligent and resourceful individuals, who’d have likely – and responsibly - realized the situation at hand: “Honey, I think we missed our window… it’s just too hot to take the Miju and Oski up those switchbacks now. Let’s wait it out till later when it cools down a bit”.
To be sure, as evidenced by the visible satellite GIF loop, a few light clouds began drifting over their location by 1:30PM, with increasing cloud cover blanketing the area by 4PM, and by 5PM the developing cloud mass from Cell 1 should have completely enveloped them. With increasing clouds now totally blotting out the blistering sun and cooling temperatures a bit, a very attractive window to resume the hike up the switchbacks would have then presented itself.
Wanting to take quick advantage of this window, the potential power of the approaching storm cell and their subsequent exposure to lightning on that barren slope simply may not have been a prescient thought at the time.
Although the above conjectures are purely MOO and based on reasoned speculation, regardless of whatever befell the family, the satellite evidence unequivocally shows that the potential for electrical phenomena to have indeed occurred late that day cannot be readily dismissed.
Lastly, the GIFs below are set to loop continuously, and if you’re using Google Chrome as a browser and would like to manually scrub the GIFs back and forth - and even save stills of any frame - there’s a great plugin that lets you do just that. Here it is: “GIF Frames” Plugin for Chrome:
Gif Frames
Just install the plugin, open (or drag) a GIF into your browser window, right click on it, and choose “Show GIF frames”. It’s a pretty cool plugin.
(GIF Credits: © WeatherOK Inc.; MapData © OpenStreetMap conributors; Rendering©Science Research Group@Heidleburg University; GIFs created and available at
www.weather.us and authorized for noncommercial use by TOS in section 2.3 at:
Terms and Conditions )